Chiller monitoring
Reading a legacy HMI without changing the chiller hardware.
I mapped HMI readings, built the acquisition path, and integrated the team's classifier with the monitoring workflow.
Start with the interface already on the machine
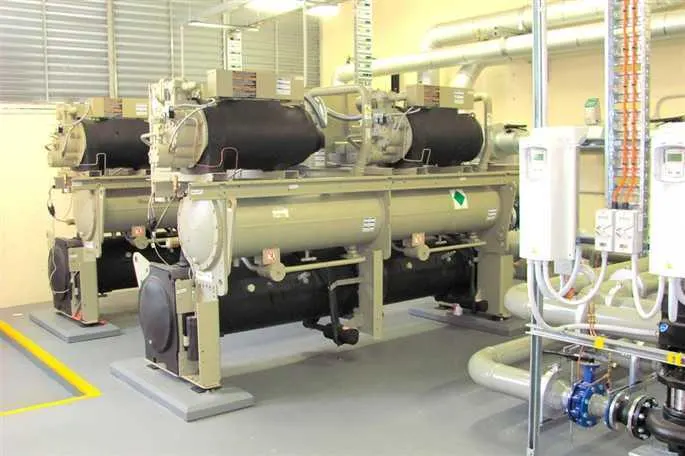
At GMF AeroAsia, chiller readings were available at the machine, but routine review relied on going to its local HMI. Our Universitas Padjadjaran project explored a remote view and a classifier for potential failure conditions without changing the chiller hardware. I coordinated the project team as a Research Project Assistant and worked on acquisition, data flow, model integration, and evaluation. Other teammates built parts of the web application and classifier.
The Pro-face HMI already served a web page with operating data. Reusing that interface kept the acquisition path alongside the existing controls. A Raspberry Pi connected over local Ethernet became the edge gateway. The hard part was finding which HMI values corresponded to the readings we needed.
Discover the readings before collecting them
The available HMI documentation did not give us a usable address map. I used the manufacturer’s simulator to change a value and observe which entry changed in its data table. Repeating that comparison let me map the needed addresses. The Pi then requested the HMI pages, parsed the returned data, and assembled a timestamped payload for the application endpoint.
The payload covered eleven operating parameters: chilled and cooling water temperatures, oil temperature and pressure, condenser and evaporator pressure, oil supply, vane position, and motor current. Mapping a name to each field made the downstream dashboard possible; checking each field’s unit and scaling remained important.
The internship report documents periodic sends and a comparison between website values and readings at the machine. That is evidence for the tested data path, not a guarantee of continuous delivery. The report’s example code and a later personal note differ on implementation language, so I describe the mechanism rather than assigning one language to the deployed acquisition program.
Connect acquisition to the team’s application
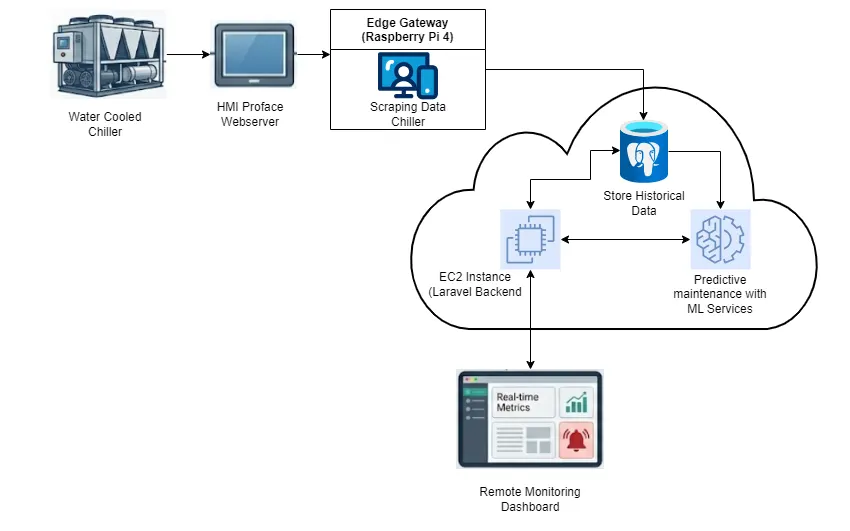
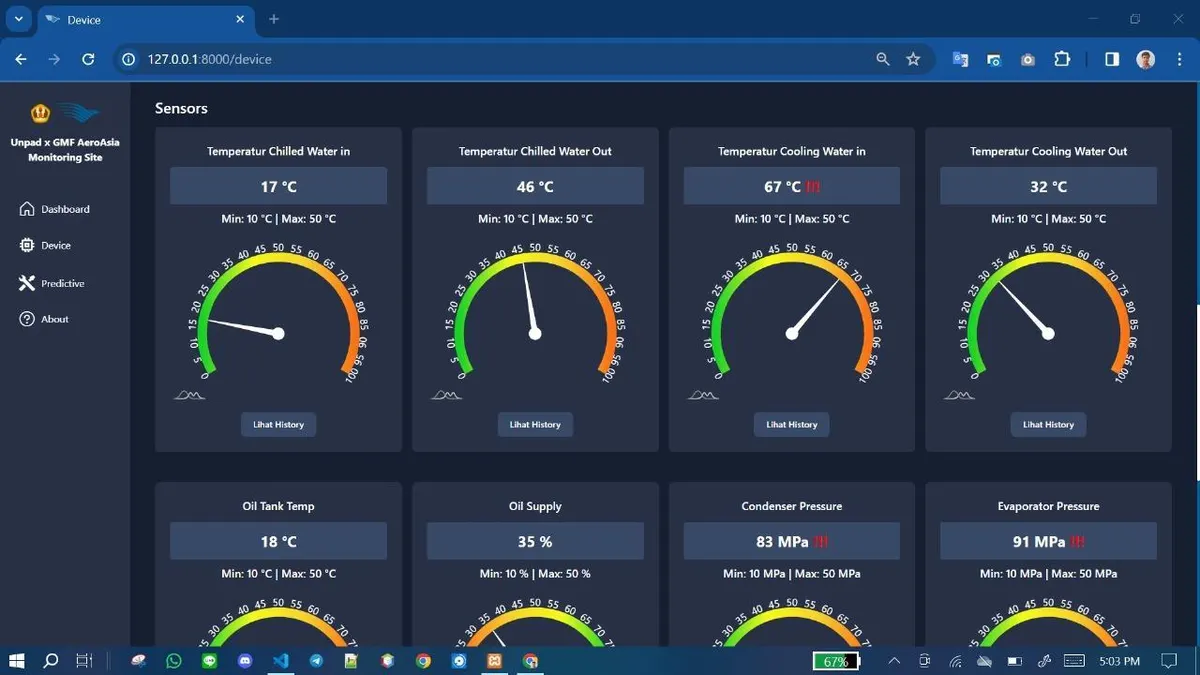
The Pi sent readings to a web endpoint for storage and display. The design placed PostgreSQL, an application backend, and the classifier in the remote workflow. My responsibility was to connect the local data to that path and integrate the model’s output; I did not build every part of the website or train the model alone. The dashboard capture in the cover uses demonstration values, so it shows the team’s interface rather than measured plant conditions.
Read the classifier result at its actual scope
The team used XGBoost to classify a condition as normal or potential failure from the collected parameters. The reported confusion matrix contains 500 evaluated examples. It shows 385 normal cases correctly classified, 15 normal cases flagged, 15 potential failures missed, and 85 potential failures detected. That is 470 correct classifications out of 500, or 94% on this reported evaluation. Potential-failure recall is 85 of 100, or 85%.
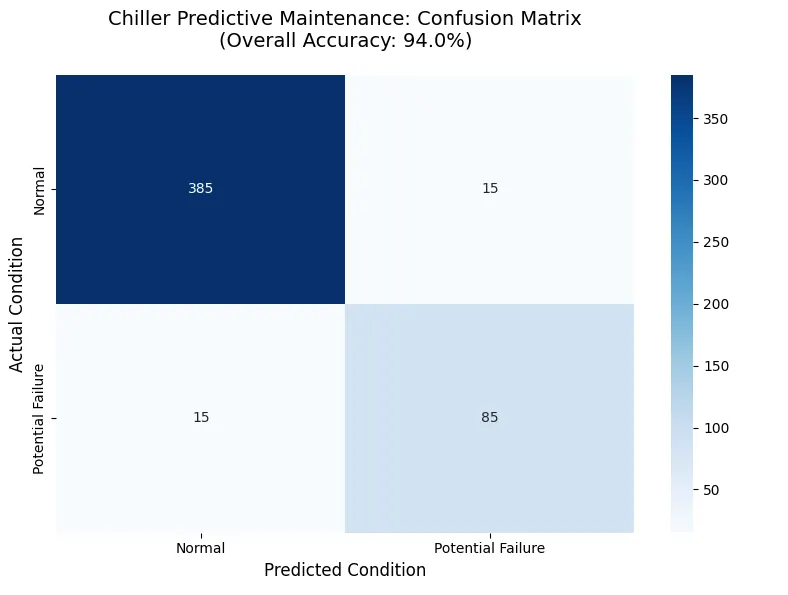
The missed potential failures matter more to a maintenance decision than the headline accuracy alone. The matrix does not tell us how the model would behave on later, time-separated equipment data, and it does not demonstrate a reduction in breakdowns or inspections.
What I would carry forward
The project reached on-site implementation. We collected named values at the Pi and compared the web display with readings at the machine; the classifier had the reported evaluation above. I would next record acquisition gaps and stale readings, verify units and scaling at the source, and evaluate the classifier on time-separated field data. The internship report also recommends restarting acquisition automatically after a power interruption. Those steps follow directly from the system we built and would make its results easier to trust during maintenance.